Jul 2026 AI traceability Using LangGraph with a local LLM 👀 How to keep track of your LLM interactions Attribution: Guozheng Ge for python code
Jul 2026 hacking vibe coding Leveraging 💪 Antigravity and Opus Free use of a great model to help me code
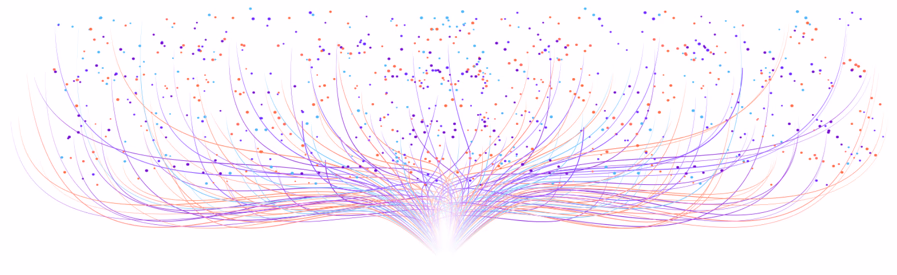
May 2026 hacking vibe coding 🎶 A brief introduction to AI Orchestration 🎶 A nice visualization of flows and orchestration Disclaimer: Claude and I wrote this
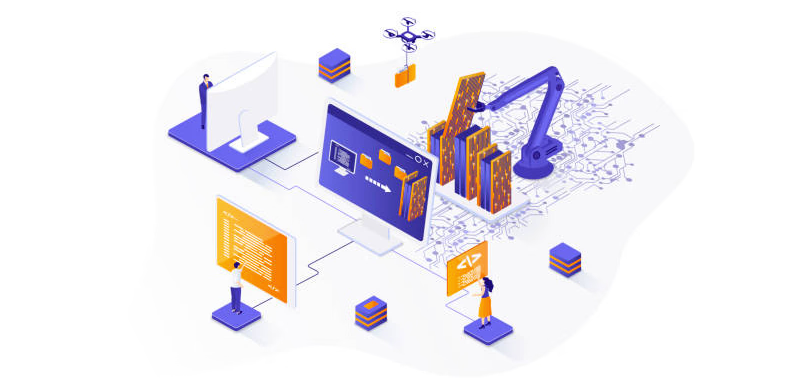
May 2026 hacking vibe coding Using Claude Code for the first time ✨ Create an genAI tech stack website with Claude Code Attribution: Raphael Moraes
Feb 2026 hacking code ethics AI Agent Coding Project ✨ Learning about the power with 400 lines of code
Nov 2024 Presenting The Art of Presenting 🎨 How to make your presentations better Attribution: © Dan Roam
Sep 2024 data story lofi Synchronization is a thing ⟺ How I automagically synchronize my Obsidian folders
Dec 2024 data story ai python Search for a job using AI 🤖 🧑💻 Automate your job search using openAI Attribution: Federico Elia, author of AiHawk
May 2024 loficode My First LoFi (local first) app ☕️ Local first allows you to work offline with private data Attribution: Scott Tolinski
Dec 2023 data story The Story of PocketHost.io 🎛️ Feels good to know people still do things for free, uh, low cost
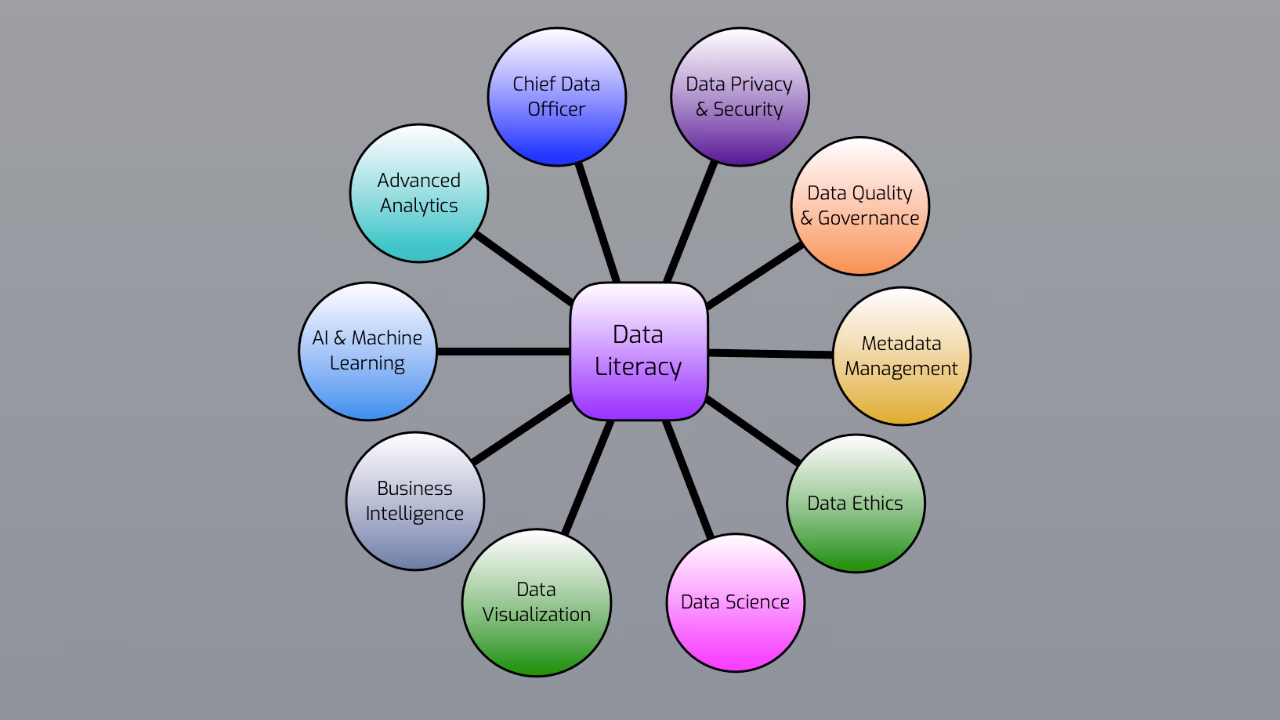
May 2022 data story infographic Data Literacy Infographic 👓 A perspective on what it means to be data literate
May 2022 data story infographic Blockchain Data Flow Infographic 🧱⛓️ A simple data flow visualization through a blockchain
Apr 2021 data story hackathon Hackathon Presentation 🧑💻 A behind the scenes look at hacking the component tree project
Nov 2019 data story linkedin On Serverless Computing: They Stole Our Servers! ¯\_(ツ)_/¯ Why you should know about serverless computing
Oct 2019 data storylinkedin What Does It Mean to be "Data-Driven"? 🚘 Data stories about using data to drive actions
Oct 2019 data storylinkedin Why Should Your Business Adopt Cloud Technology? 🌥️ You should identify the best possible method of running your applications
Aug 2026 hacking gizmos Stereo volume knob with LED switch 🎛️ A nice representation of some cool controls
Jun 2026 hacking shader art Morphing Mandelbrots in beautiful colors ∞ A simple visualization of Mandelbrot expressions Shader algorithm by pixelomo
Jun 2026 web art Spawning Tubes 🛠️ Fun to watch pipes being created Attribution: three.js examples Ah, the NT 3.5 screensaver in modern colors
Jun 2026 web art Soothing Web Art 🧘🏻♂️ A nice flow to watch and relax Shader Algorithm by Sophia (fractal kitty)
Dec 2024 culture code Schotter by Georg Nees A nice Svelte representation of Nees' great art Attribution: Georg Nees Attribution: Svelte Tutorial
Jun 2024 culture D3 code Country Flags of the World 🌏 A nice hierarchical data visualization of country flags Attribution: Curran Kelleher Attribution: Lipis
Dec 2023 data science Interactive Visualizations of Several Regression Types 📈 Explore and interact with various regressions
Nov 2023 data vizcode Conway's Game of Life 🧪 Initial experiment invoking a GPU with the webGPU API Attribution: Google Code Lab
Nov 2023 apisvelte Github API via Vercel 🌎 Gain access to github contributions (Note: no longer functional) Attribution: Joy of Code
Jul 2022 data vizinteractive Component World 🔥 An exploration of Talend's data components in three dimensions
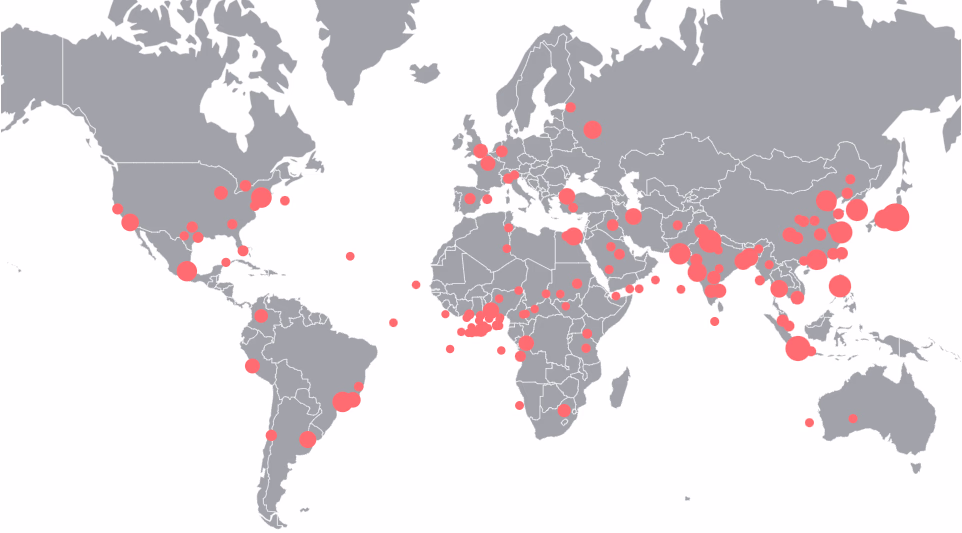
Jul 2022 data viz Globular Sales Visualization 🌎 A simulation of fictitious revenue amounts around the world
Jul 2022 data vizinteractive Component Tree 🌴 A searchable tree graph of Talend's data components Version 8
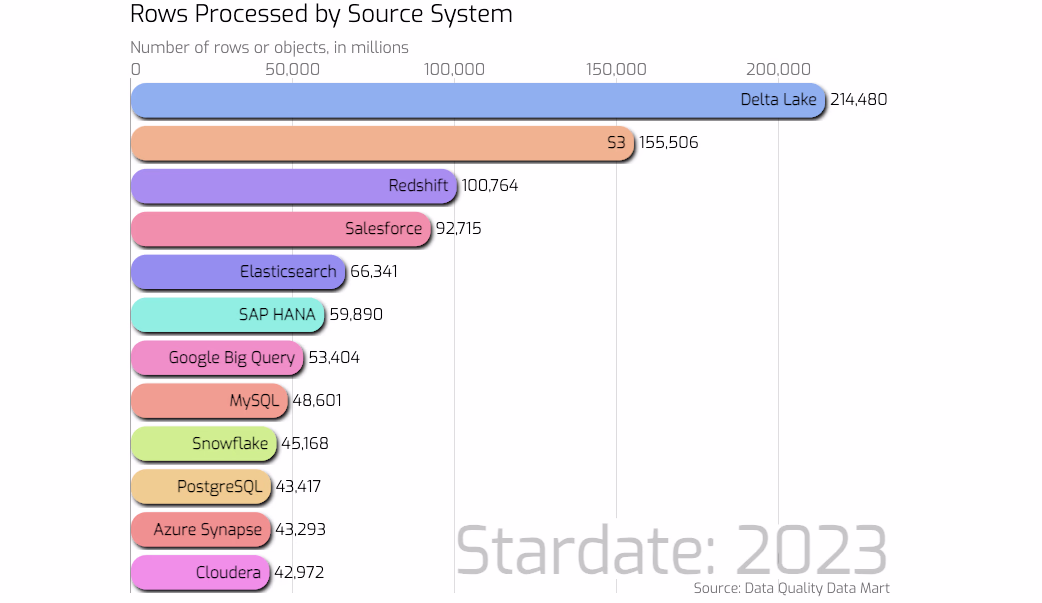
Mar 2022 data viz Source System Data Bar Chart Race 📶 An animation of performing operations on source systems
Dec 2022 data vizwidgets Animated Arc Chart 🌇🌆🏙️🌃 How to show state across multiple systems with an average
Nov 2025 3-d data viz Girl With a Pearl Earring 🎨 This is a beautiful 3d model from Vermeer's painting. Not mine. I wish. Attribution: hinxlinx
Oct 2025 3-d data viz threlte Things Go Bump 🙀 Showing off with the GPU Attribution: Threlte examples
Sep 2025 3-d data viz threejs Particle Attractors 🧲 Fun with particles and the GPU Attribution: Threejs examples
Oct 2024 3-d data viz threlte A Spoooky Pumpkin 👻 🧪 An experiment with threlte Attribution: Joy of Code
Sep 2024 3-d data viz threejs The Periodic Table in 3-D 🧪 Learn about the elements Attribution: Threejs examples
Sep 2024 3-d data viz threlte 3-D Penrose Triangle The impossible in three dimensions! Attribution: Michael Ostroff
Sep 2024 3-d data viz threlte 3-D for the masses 🌐 + 👓 + 🚀 Understanding how threlte works by creating a digital ticket Attribution: Grischa Erbe
Jan 2024 3-d data viz css Tower of Cubes Animation 🧊 An animation of cubes climbing a tower Attribution: Amit Sheen
Nov 2023 3-d data vizthrelte Github Contributions in 3-D 👓 Using threlte for visualizing data Attribution: Joy of Code
Jun 2026 simulation Atmospheric Jellyfish Sprite ⛈️ A stratospheric phenomenon literally - sim on the left, reality on the right
Dec 2024 interactiveplay Neko the cat 🐱 An experiment with Svelte 5 runes Attribution: adryd325's oneko Attribution: Stanislav Khromov
Oct 2024 code drizzle turso How long is a click? Ever wonder how fast you can click? This app answers
Mar 2024 data sciencecode Revisiting the "hello world" of data science with Knime 👨💻 This approach sorta implies, "Why use python?"
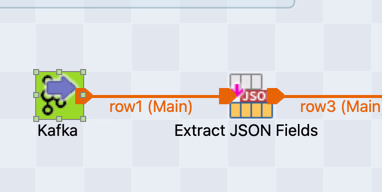
Oct 2023 data engineeringcode Kafka Streaming Job ∿∿↝ Easy to setup route to stream and manipulate Kafka messages using Talend Studio
Nov 2022 data sciencecode Who survives? ☠️ The "hello world" of data science and get on the raft Jack!
Aug 2019 data engineeringcode Fuzzy Wuzzy - a match made in fuzziness 🌀 Jupyter notebook compares two lists using fuzzy (Levenshtein) matching
Nov 2013 paper data qualitylegacy A Delicious Architecture 🎂 How the architecture of a Data Quality application emulates a trifle
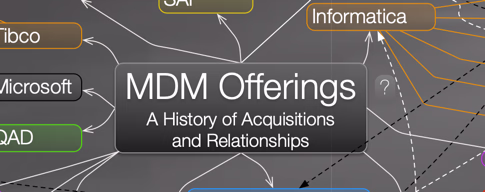
Apr 2011 paper MDMlegacy MDM Sizing Examples 📐 Real world data from several master data management implementations
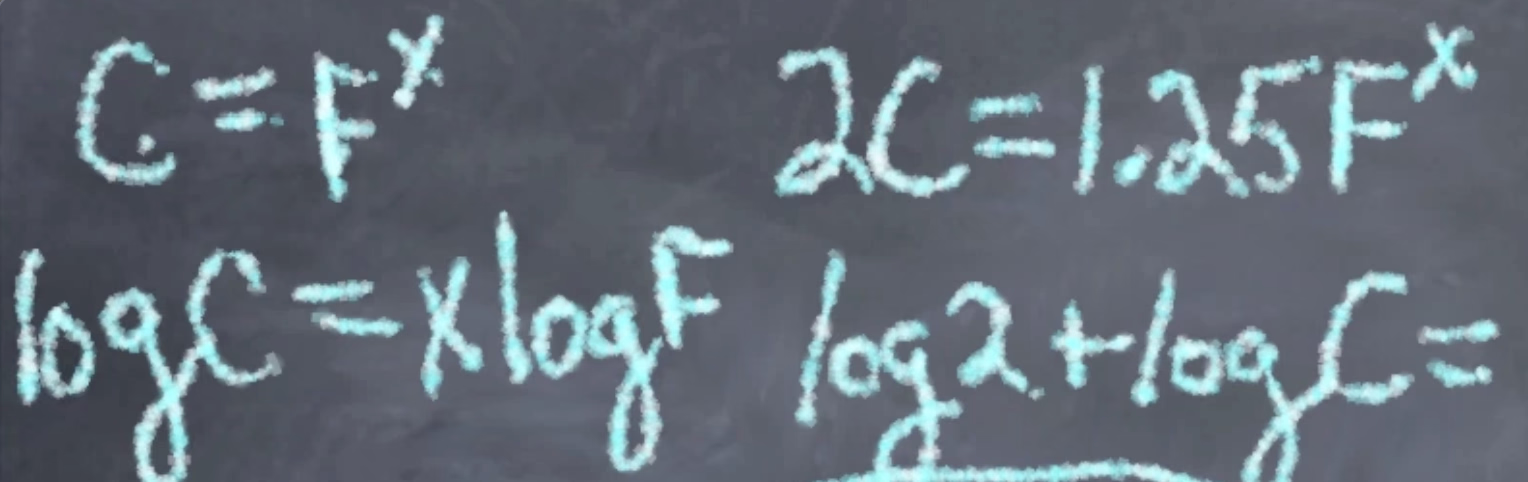
Jul 2012 paperanalysis math The Mathematics Behind the Complexity Analysis 🧮 How to derive the complexity algorithm
Jun 2009 paperlegacy Identity Resolution Explained 🆔 More than you want to know about matching algorithms
Dec 2023 data storyhand-drawn Monday's branding experiment 🧪 A cartoon depicting the ease of implementing a data fabric Attribution: Randall Munroe
Dec 2023 data vizinteractive Tuesday's branding experiment 🧪 A searchable tree graph of Talend's data components
Dec 2023 data storyhand-drawn Wednesday's branding experiment 🧪 A cartoon depicting an interesting user interface prototype using a video game patina
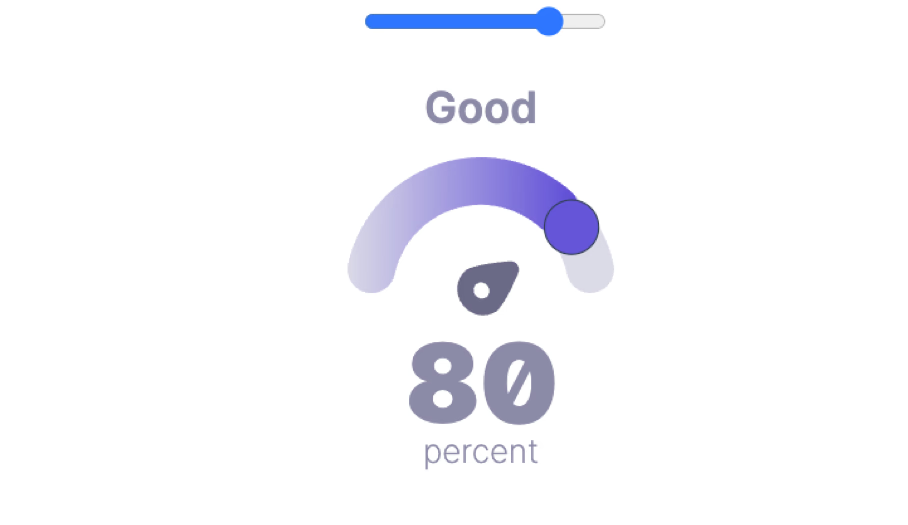
WIP data story Friday's branding experiment 🧪 A live dashboard of what your data quality efforts should be
Dec 2023 data storyhand-drawn Saturday's branding experiment 🧪 A silly example of meta-data adapted from XKCD #688 Attribution: Randall Munroe
.")